
LANGHORNE, PA—May 8, 2014—E-Mon, the electric submetering market leader and manufacturer of the widely installed E-Mon D-Mon® product line, today announced that it is now offering Honeywell’s Attune™ Energy Dashboard service to provide facility management professionals with an effective and user-friendly dashboard of energy usage and trends.
The cloud-based Attune Energy Dashboard service accesses historical and real-time energy-usage data from a variety of meters including E-Mon D-Mon submeters, electric, gas, water, steam, BTU, etc. By viewing and analyzing this energy consumption information, facility managers are able to gain insight into building and process performance, establish baseline patterns and identify energy savings opportunities.
“Facility managers are under increased pressure to go beyond simply monitoring building systems and providing base-level comfort,” said Don Millstein, president of E-Mon. “The Attune Energy Dashboard service offers them crucial access to specific usage data from multiple E-Mon meters so that they can make decisions resulting in improved energy efficiency and overall cost savings.”
With this service, E-Mon D-Mon smart meters are connected via the industry-standard Modbus TCP/IP communication protocol to the data warehouse where the facility’s actual energy data is posted to the password-protected, web-based Attune Energy Dashboard. The customizable dashboard displays analytics as widgets in a graphically intuitive interface, making them easy to understand. Each site on the dashboard has a unique customizable Current Consumption display that includes a variety of widgets, graphs and charts showing energy consumption data for electric, gas, water, fuel oil and/or steam. Some available widgets include:
• Building Profile
• Site Information
• Electricity Cost
• Building Operating Schedule
• Weather Information and Degree Days
• Electric, Gas, and Water Trends
• Electric, Gas and Water Gauges
A reporting feature of the Attune Energy Dashboard allows users to create and export CSV file reports for outside temperature, demand, previous period and relative humidity by hour, week, day and month for selectable date ranges either by individual meters or aggregate meters. Visit www.emon.com/attunedemo.asp to view the dashboard demo.
To request the Attune Energy Dashboard service, call 1-800-334-3666 or visit www.emon.com.
 Elevating EVS Professionals: The Case for Certified Hygiene Specialists
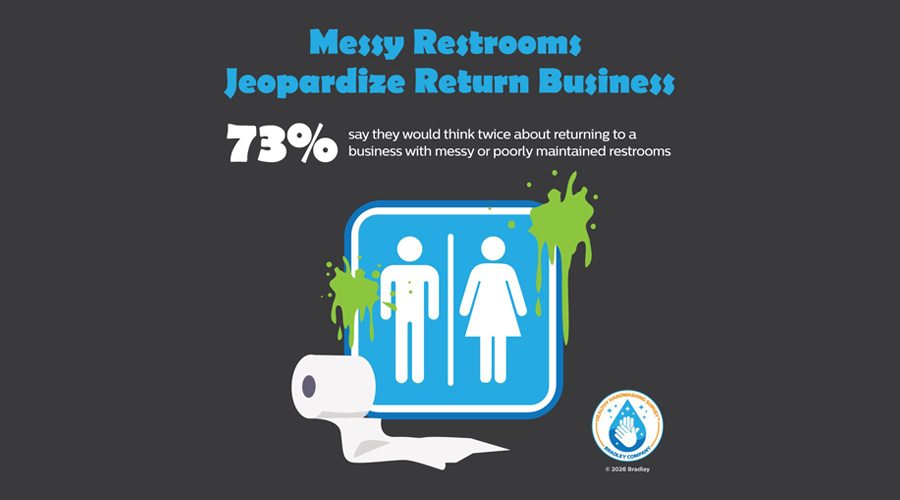 Global Handwashing Day and the Importance of Well-Maintained Restrooms
 Duke Health and CaroMont Health Partner to Develop Two New Hospitals
 Designing for the Psychology of Waiting
 UT Health Sciences Breaks Ground on College of Medicine Interdisciplinary Building